Harper Baumann · 20 October 2026
Advanced Imaging Techniques Reveal Shifts in UK Forest Canopy Health Tied to Pollution Sources
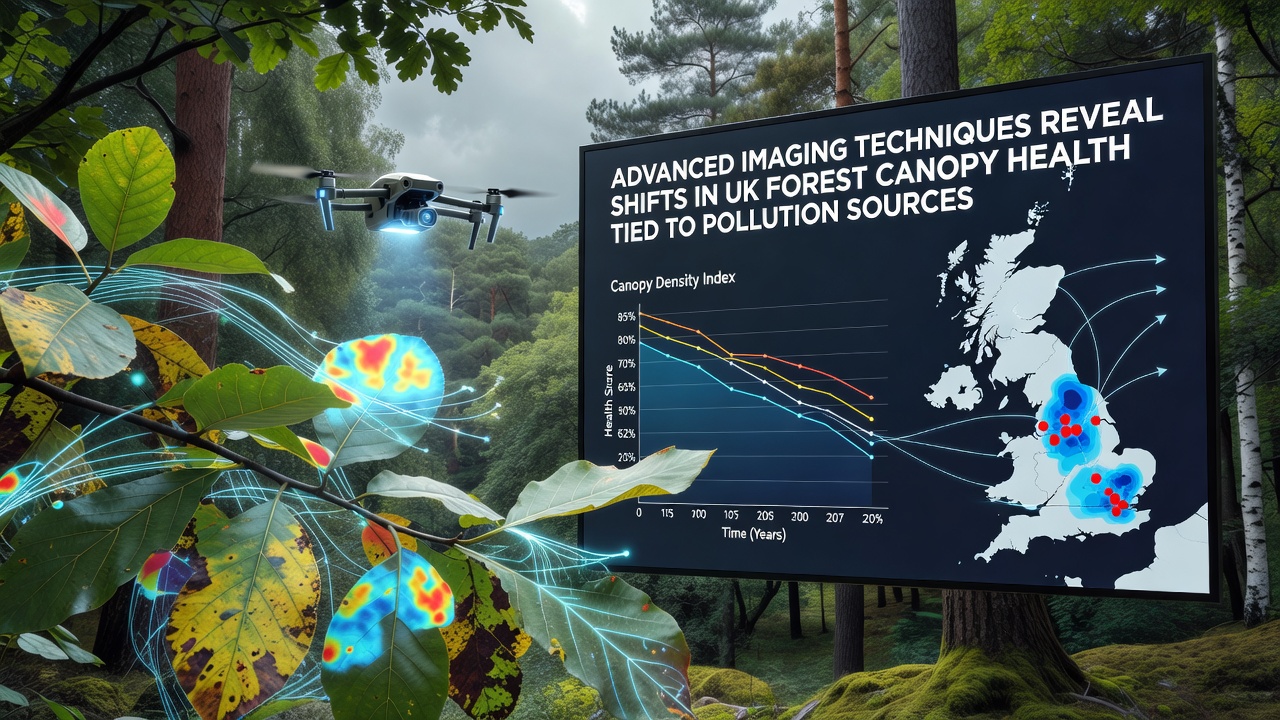
Researchers have applied hyperspectral imaging combined with LiDAR surveys to track alterations in forest canopy structure across multiple UK regions, and these methods detect variations in leaf density plus chlorophyll levels that align closely with known pollution gradients from industrial and agricultural sources. Data collected through 2026 shows measurable declines in canopy vitality in areas exposed to elevated nitrogen oxides and sulfur compounds, while zones with lower emissions maintain more stable reflectance patterns in the near-infrared spectrum.
Forestry Commission records indicate that broadleaf stands in the Midlands and parts of northern England exhibit the most pronounced shifts, with canopy closure rates dropping by up to 12 percent in monitored plots between 2020 and 2025. Airborne campaigns flown in spring and autumn capture seasonal differences that ground surveys alone often miss, allowing analysts to map stress indicators at scales of individual tree clusters.
Mapping Pollution Pathways Through Canopy Signatures
Advanced sensors distinguish between direct foliar damage and indirect effects such as altered soil chemistry that limits nutrient uptake. Nitrogen deposition from nearby livestock operations and vehicle corridors correlates with increased canopy discoloration in beech and oak stands, whereas ozone exposure near urban fringes produces distinct spectral signatures in pine plantations. These patterns emerge consistently when researchers overlay emission inventories from the Department for Environment, Food and Rural Affairs with the imaging datasets.
One study released in October 2026 combined drone-based multispectral flights over the Peak District with satellite archives dating back fifteen years, revealing gradual canopy thinning that accelerates after spikes in ammonia concentrations. Observers note that such integrated approaches reduce uncertainty compared with traditional vegetation indices alone, because they capture both structural volume and biochemical changes simultaneously.
Regional Variations and Data Integration
Scotland's conifer forests show slower but persistent responses to acidifying pollutants, with LiDAR point clouds indicating reduced crown volume in plots downwind of former coal operations. In contrast, Welsh upland woodlands display more localized impacts tied to intensive farming, where ammonia plumes drift into adjacent protected areas. Cross-referencing these observations with air quality monitoring stations operated by the Environment Agency helps isolate dominant pollution vectors for each site.
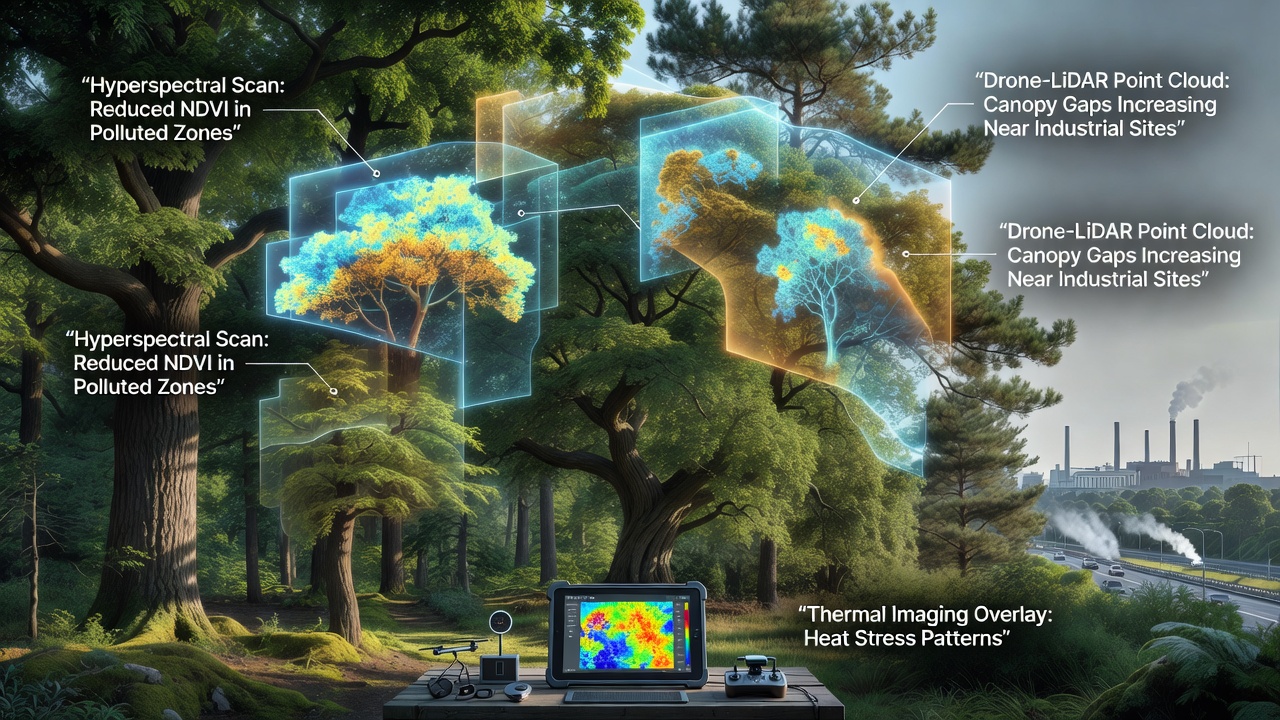
European Environment Agency reports on transboundary air pollution supply additional context, showing that some canopy stress signals extend beyond national boundaries and require coordinated measurement strategies. University teams in Manchester and Edinburgh have begun fusing these continental datasets with UK-specific imaging to improve predictive models of future canopy trajectories under varying emission scenarios.
Applications for Forest Management Planning
Land managers now use the detailed canopy health maps to prioritize restoration sites and adjust thinning schedules that might otherwise compound stress in already affected stands. The imaging outputs feed directly into decision-support tools that forecast recovery timelines once emission controls tighten, and several regional authorities have incorporated the findings into their air quality action plans. Evidence from repeated flights demonstrates that canopy metrics stabilize within two to three growing seasons after measurable reductions in local nitrogen loads.
Continued expansion of these techniques relies on open data policies that allow integration of commercial satellite feeds with public LiDAR archives, and analysts expect coverage gaps in remote upland forests to narrow as sensor costs decline. Current protocols already provide repeatable baselines that support long-term trend detection rather than isolated snapshots.
Conclusion
Advanced imaging therefore supplies precise spatial and temporal resolution for linking canopy condition to specific pollution sources across UK forests, and ongoing campaigns will refine these connections as emission inventories and sensor networks evolve in parallel.