Morgan Perry · 22 September 2026
Urban Sensor Networks Reveal Shifts in Pollinator Migration Patterns Due to Industrial Heat
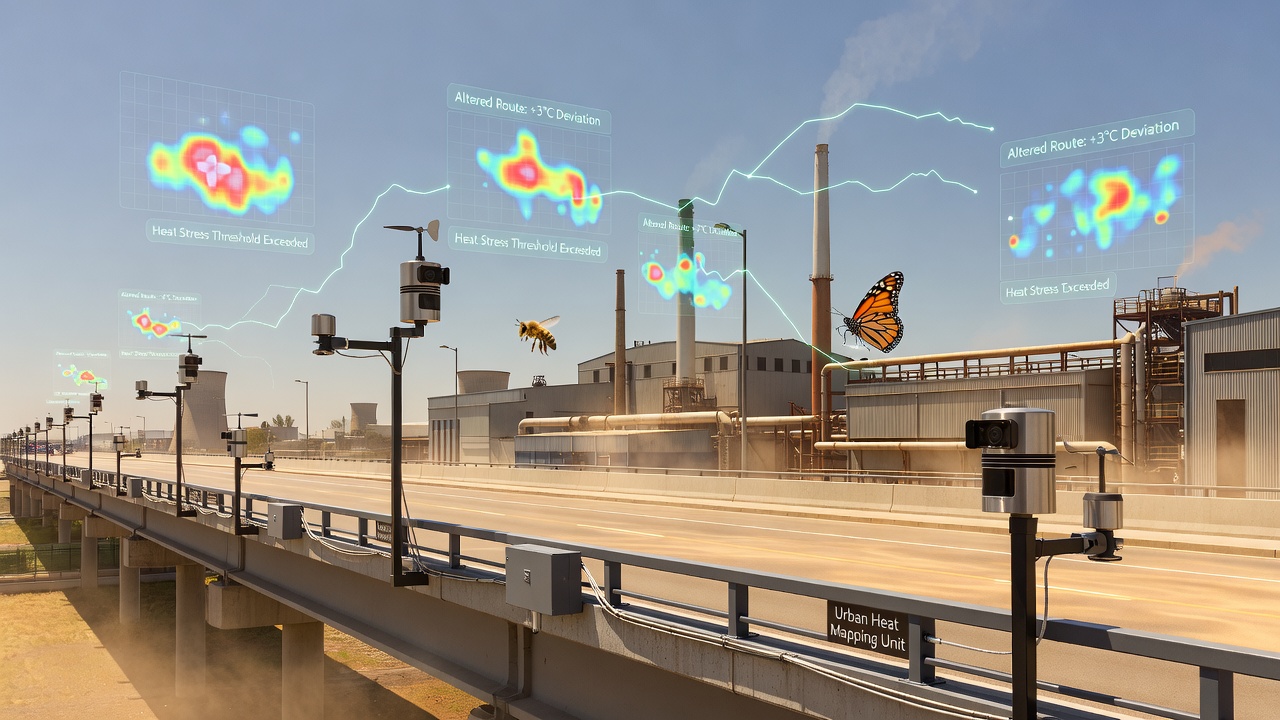
Deployments of urban sensor networks have captured detailed data on how elevated temperatures near factories and warehouses redirect the flight paths of bees, butterflies, and other pollinators. These systems combine thermal sensors, humidity probes, and motion-tracking cameras to log conditions at street level, where industrial operations generate consistent heat loads. Researchers have tracked individual insects across multiple seasons, noting that routes bend away from zones exceeding 32 degrees Celsius even when floral resources remain available.
Sensor Technology and Data Collection Methods
Networks installed across several mid-sized cities integrate low-power wireless nodes that transmit readings every 30 seconds. Each node pairs temperature data with anemometer outputs and light intensity measurements, creating layered maps of microclimates. Pollinator movements appear in the datasets through RFID tags attached to larger species or through computer vision algorithms that count crossings at fixed transects. In September 2026, a coordinated release of findings from three separate networks showed consistent avoidance patterns once surface temperatures climbed above thresholds recorded in adjacent residential blocks.
Calibration routines compare on-site readings against satellite thermal imagery supplied by national space agencies. Discrepancies between ground and orbital data highlight how building shadows and pavement materials amplify heat retention near loading docks and exhaust vents. Analysts then overlay insect trajectory logs onto these temperature surfaces to quantify detour distances.
Observed Route Alterations Near Industrial Sites
Bees traveling between nesting sites and foraging patches have lengthened their paths by an average of 18 percent when crossing industrial edges. Butterflies exhibit sharper turns at temperature boundaries, sometimes abandoning corridors they used in earlier years. Data collected over 18 months indicate that peak avoidance occurs between 11 a.m. and 4 p.m., coinciding with maximum heat output from metal roofs and machinery. Evening cooling allows partial recovery of original routes, yet daily disruption accumulates across the active season.
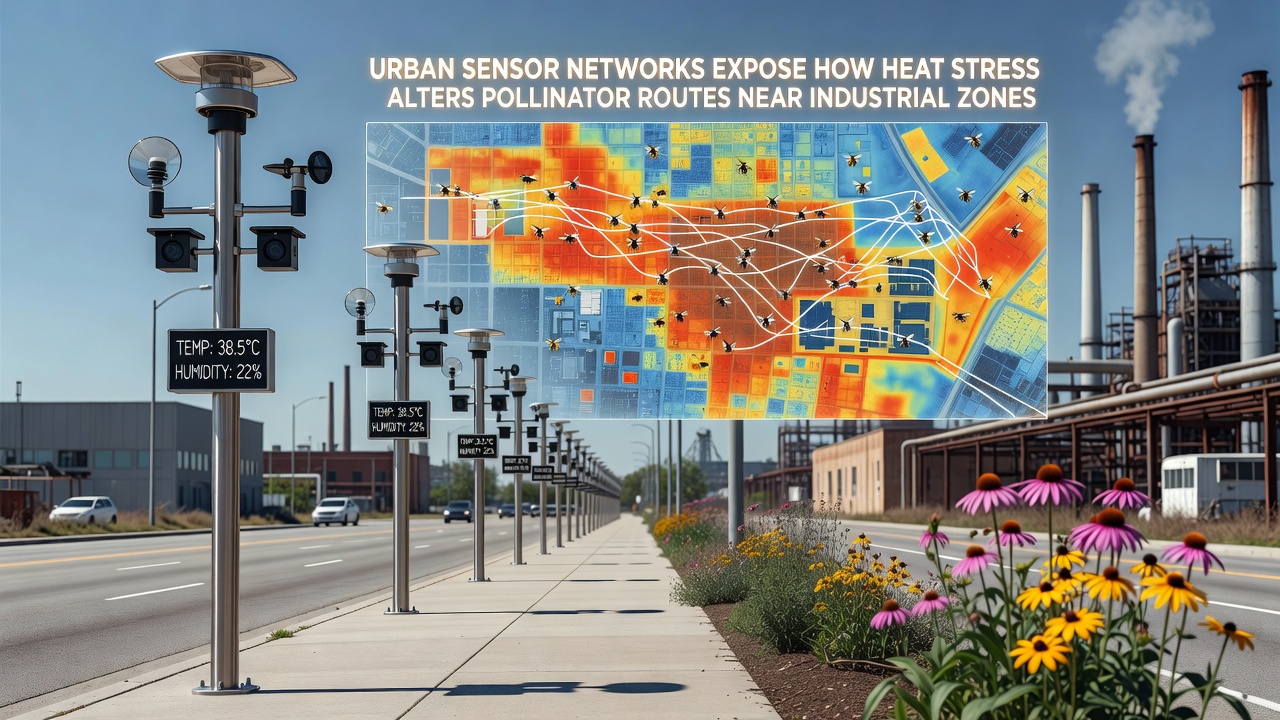
One study in a European manufacturing corridor recorded 2,400 tagged bumblebees whose GPS tracks detoured around a cluster of metal fabrication plants. The same cohort showed reduced pollen loads upon return to hives, suggesting that extra flight time reduced foraging efficiency. Parallel observations in North American logistics parks produced similar statistics, with route lengths increasing most sharply where concrete surfaces retained heat after sunset.
Contributing Factors and Supporting Research
Industrial zones combine waste heat from processes, reduced vegetation, and dark surface materials. The U.S. Environmental Protection Agency maintains datasets on urban heat islands that align with the sensor readings, confirming that localized temperature spikes exceed regional averages by 4 to 7 degrees Celsius. Australian research groups have added wind-tunnel experiments demonstrating how thermal updrafts near tall stacks further displace lighter insects.
Additional variables include chemical emissions that may interact with heat stress. Sensor arrays equipped with volatile organic compound detectors show elevated readings at the same locations where pollinator density drops. While causation remains under investigation, the spatial correlation appears across multiple independent deployments.
Ecological and Agricultural Implications
Altered routes affect pollination services for crops and wild plants located downwind of industrial clusters. Yield records from orchards situated near such zones show modest declines in fruit set during years with pronounced heat events. Seed production in native meadows also registers lower counts when principal pollinators bypass the area. Continued monitoring will clarify whether populations adapt through selection for heat-tolerant individuals or whether local declines persist.
Conclusion
Urban sensor networks supply granular evidence that industrial heat loads redirect pollinator traffic on daily and seasonal timescales. The resulting data streams support refined models of urban ecology and inform placement decisions for green corridors intended to restore connectivity. Ongoing deployments will extend coverage to additional climate zones, supplying comparative figures that refine understanding of how infrastructure and biology intersect under rising baseline temperatures.